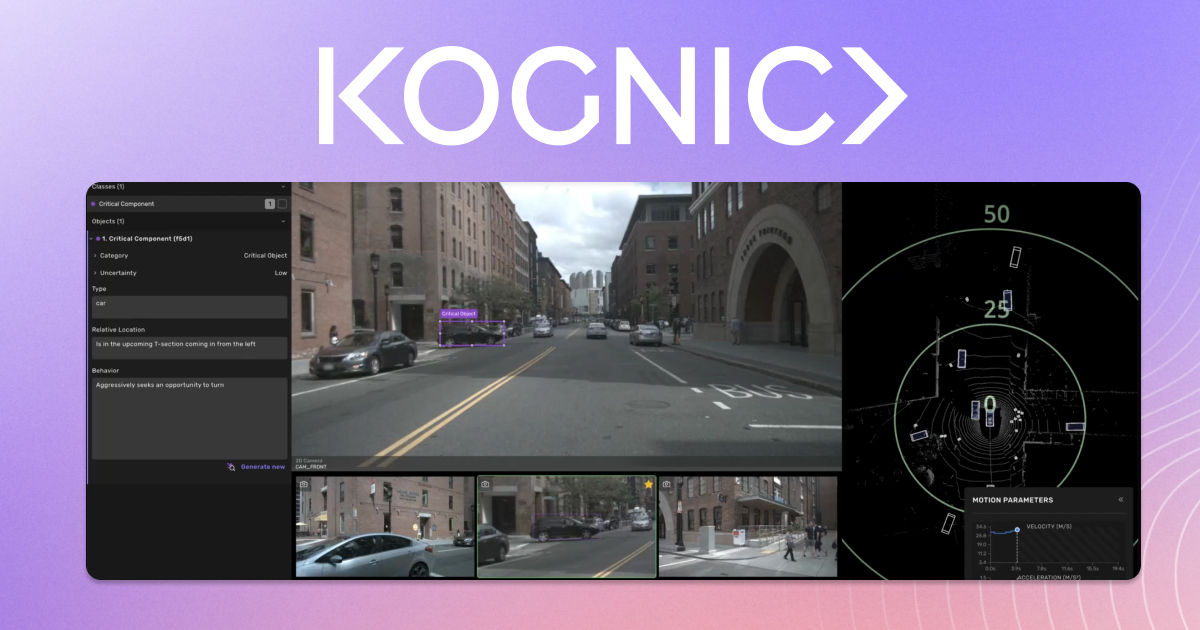
The quality of your machine learning outcomes depends directly on the quality of your data. At Kognic, we've established ourselves as the price leader in autonomous driving annotation through our unique combination of Platform, Processes, and People. This integration enables our customers to get the most annotated sensor-fusion data for their budget while maintaining exceptional quality standards—because machines learn faster with human feedback.
When setting up your annotation project, the first crucial question to address is whether you're annotating sensor data or the underlying reality it represents. Many assume annotations automatically provide "ground truth," but this isn't always the case. What human annotators see is merely a snapshot of reality captured through sensors (cameras, LiDAR, etc.)—each with their own limitations and distortions. This is where expert human judgment becomes essential.
Understanding Sensor Distortion: The Reality Gap
Sensor data inherently contains various distortions that differ between camera and LiDAR systems, and even vary across different models and manufacturers. While some distortions are easily identified and corrected, others present more complex challenges that require sophisticated human feedback to resolve. Let's examine three common phenomena that impact annotation accuracy in autonomous driving applications:
The Rolling Shutter Effect
Camera images often suffer from the rolling shutter effect, beautifully demonstrated in this video from the 'Smarter Every Day' YouTube channel. This effect causes moving vehicles to appear wider or narrower depending on both camera shutter speed and vehicle velocity. Even the most meticulous annotation cannot provide a true representation of reality without accounting for this distortion—this is where trained human annotators add critical value.
LiDAR sensors face similar challenges since they scan environments sequentially using laser beams. Depending on the scan pattern, moving vehicles can appear strangely deformed—making it challenging to accurately estimate their true dimensions without expert judgment.
The images below compare camera view with Luminar LiDAR point cloud data from the Cirrus dataset. Note how the approaching van appears elongated in the point cloud with diagonal outlines at both ends—a perfect illustration of how LiDAR data doesn't perfectly mirror real-world objects and why human feedback is essential for accurate interpretation.


Multiple Impressions of the Same Object
When your vehicle has multiple LiDAR sensors and is scanning moving objects, you'll often see the same object captured at different positions within your point cloud. This occurs because different sensors detect the vehicle at slightly different times and locations. This multiplicity further complicates accurate vehicle length estimation and requires expert human judgment to resolve.
This phenomenon is clearly visible in Audi's A2D2 dataset, which utilizes five LiDARs. This video demonstrates the effect dramatically when focusing on the bright points representing a vehicle's license plate.
The Blooming Effect
LiDARs measure distance by calculating how long light beams take to return after emission. One significant challenge is that highly reflective surfaces often appear larger than their actual size—known as the blooming effect. While LiDARs typically maintain precision within 2 centimeters, this effect can lead to overestimation of reflective object dimensions.
The image below illustrates this phenomenon, where points to the right of the truck represent LiDAR noise rather than the actual vehicle. Trained annotators who understand these artifacts can distinguish between actual object data and sensor noise—delivering annotations that more accurately reflect reality.
Blooming effect - Kognic Platform
Bridging the Gap Between Sensor Data and Reality
This brings us to our core question: what exactly are you annotating—sensor data or reality? The approach fundamentally changes how annotations are created and highlights why human expertise matters:
Annotating sensor data: Drawing bounding boxes around all pixels or points belonging to an object, regardless of distortion.
Annotating reality: Drawing bounding boxes where objects actually exist, potentially excluding some sensor points identified as noise—this requires trained human judgment.
At Kognic, we invest heavily in our Annotator Academy to train professionals to distinguish between actual object data and sensor artifacts. By specializing exclusively in multi-modal real-world autonomy data, our annotators deliver higher quality results that more accurately reflect reality. This is how we combine People, Platform, and Processes to deliver exceptional value.
This distinction leads to another critical consideration: what level of annotation precision can you realistically expect?
Measuring Precision: The Highway 'Inter-Annotator Agreement' Experiment
Understanding the difference between annotating sensor data versus reality prompted us to investigate annotation precision limits. Since comparing annotations to actual geo-referenced trajectories isn't always feasible, we developed an alternative metric: inter-annotator agreement—measuring how consistently different annotators label the same data with identical information access.
We conducted an experiment where trained annotators independently labeled the same highway LiDAR sequence twice, allowing us to calculate agreement levels for various vehicle dimensions.
The technical challenge stems from LiDAR's inherent sparsity. For instance, a Luminar Hydra with 0.07-degree horizontal resolution provides points spaced 12.2 centimeters apart at 100 meters distance. When annotating vehicles traveling toward you at highway speeds, this creates fundamental precision limitations that require expert human feedback to navigate.
Our findings confirmed that width and height measurements showed strong inter-annotator agreement, with discrepancies rarely exceeding 30 centimeters. However, length estimation (more challenging from a rear view) occasionally showed disagreements up to 80 centimeters—revealing important insights into annotation reliability thresholds and the importance of trained human judgment.

Advanced Approaches: 3D CAD Models in Annotation
Some annotation tools attempt to bridge the reality gap using more sophisticated methods. The "nyc3dcars-labeler" developed by Kevin James Matzen for the NYC3DCars dataset aligns images to real-world coordinates and places 3D CAD models on the ground plane to estimate object positions.
While this approach can increase confidence in annotations, it also introduces risks by potentially creating false precision. The paper "3D Object Detection and Viewpoint Estimation with a Deformable 3D Cuboid Model" demonstrates this hazard—initial results appear impressive, but closer examination reveals incorrect vehicle orientations and classifications that aren't immediately apparent. This underscores why human oversight remains critical.
3D Object Detection and Viewpoint Estimation with a Deformable 3D Cuboid Model - results
The Kognic Approach: Where Human Feedback Meets Automation
At Kognic, we've built our platform on a fundamental principle: machines learn faster with human feedback. We support both sensor data and reality-based annotation approaches, combining three essential elements that make us the price leader in autonomy annotation:
- People: Domain experts specialized in multi-modal real-world autonomy data, especially ADAS/AD, working under ethical standards and trained to provide expert judgment on complex annotation challenges
- Platform: Maximizing automation while optimizing user experiences to minimize manual effort—we integrate automation wherever possible while ensuring human feedback guides the process where it matters most
- Processes: Robust, scalable workflows coordinating hundreds or thousands of annotators on shared datasets, building the control plane for human feedback that routes attention where it's needed
We focus exclusively on the automotive sector, continuously improving our capabilities to deliver both sensor-accurate and reality-representative annotations. Whether you should pursue one approach or the other depends entirely on your specific use case—and we're here to help you make that determination.
Despite advancing automation capabilities, we firmly believe human oversight remains essential for maintaining annotation quality and road safety. The world's complexity and ever-emerging edge cases mean fully automated annotation cannot deliver the trustworthiness required for safety-critical applications. Physics doesn't tell you when to yield, and simulations don't decide what counts as safe enough—that requires human judgment.
We establish trust through human verification of every annotation, ensuring that your autonomous systems are not only trained on accurate data but are also aligned with human intent, judgment, and expectations. This human-in-the-loop approach is what enables us to deliver the most annotated sensor-fusion data for your budget while maintaining the quality standards required for safety-critical applications.
Ready to enhance your autonomous driving development with industry-leading annotation quality and cost-efficiency? Contact us today to discover how Kognic's unique combination of human expertise and platform automation can accelerate your path to production!