Safe autonomous and ADAS vehicles depend on excellent perception systems to understand their surroundings and move safely. These systems rely on deep neural networks trained on massive amounts of data. As autonomy scales—with companies like Waymo delivering over 250,000 paid autonomous rides weekly—the quality and cost-efficiency of training data becomes increasingly critical.
Our customers are building the future of autonomous systems. When debugging perception issues, they excel at optimizing data pipelines and experimenting with architectures. However, we've observed that developers frequently face two critical questions:
- Do I have sufficient volume of data to train this model on this scenario or class?
- Is the label quality sufficiently good to train this model on this scenario or class?
This post focuses on the second question, where our Dataset Quality Analytics product helps teams maximize their annotation budget. We'll address the first question in an upcoming post about our Data Coverage product. 👇
Understanding Label Quality: A Critical Cost Factor
Trustworthy training and validation data is the foundation of any autonomous system. Understanding if annotations meet quality requirements is a challenge that directly impacts development costs and timelines.
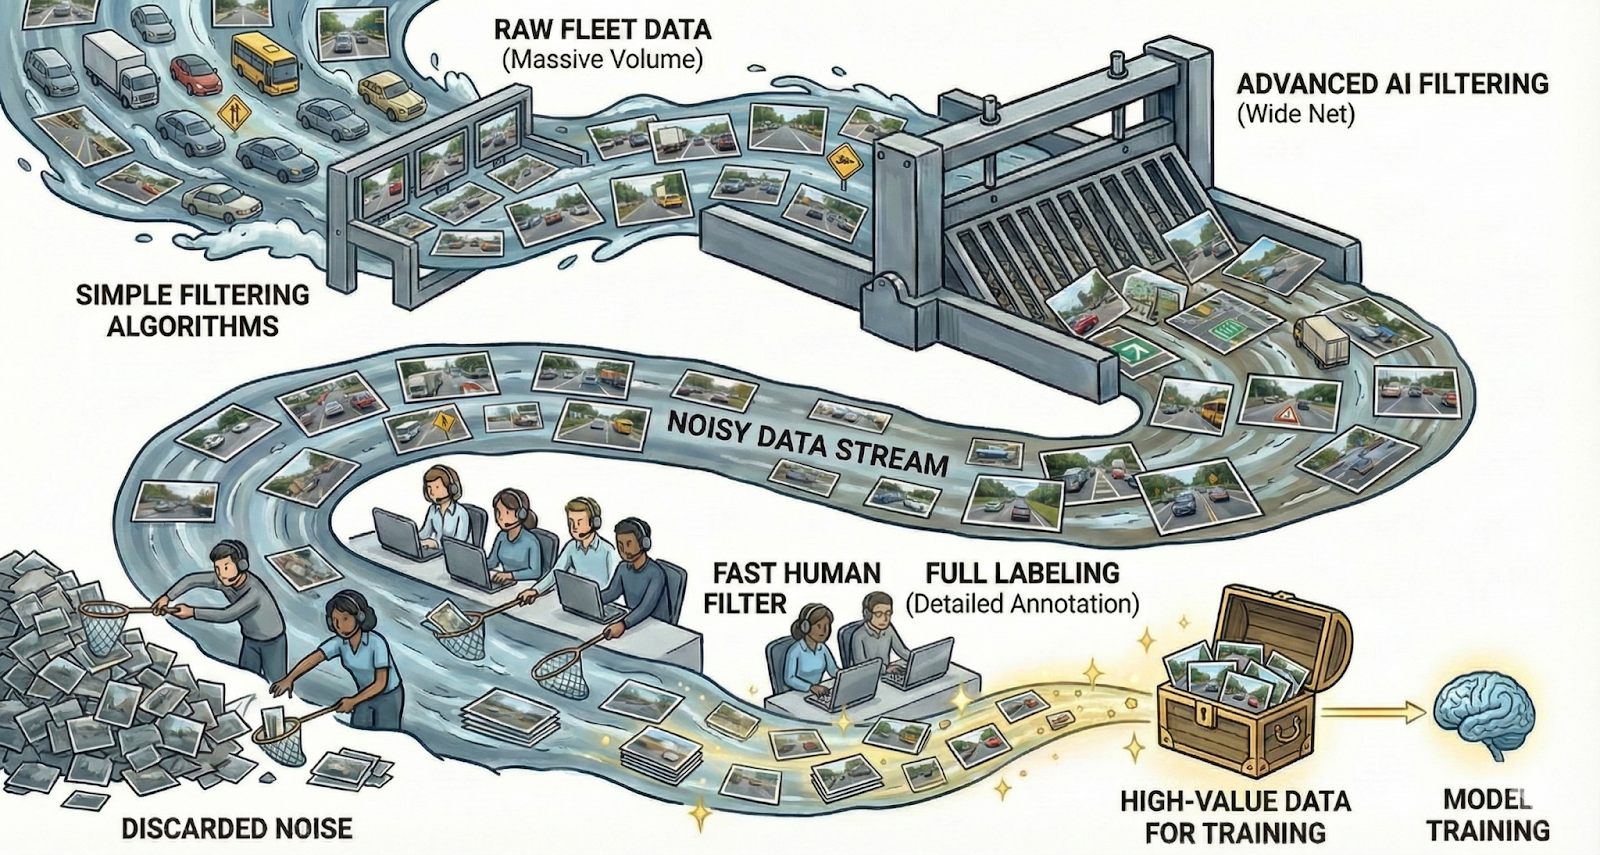
Most teams spend considerable time manually reviewing data to assess quality. At Kognic, we've observed this work is typically semi-structured, identifying mislabeled data points that need correction. While some annotation errors are inevitable, many data irregularities stem from inconsistent interpretations and labeling guidelines—issues difficult to spot through manual review alone.
As autonomy datasets grow exponentially (with fully-featured autonomous stacks producing up to 4TB of raw data per vehicle per day), objective dataset quality metrics are essential for cost-efficient development. At Kognic, we've developed methods to measure dataset quality robustly, helping clients understand if their data investments are delivering value. Our Dataset Quality Analytics product helps you get the most from your annotation budget. ⚡
Dataset Quality Analytics: Maximum Value from Your Annotation Budget
Dataset Quality Analytics delivers significant ROI for teams developing perception systems.
First, DQA eliminates costly manual data review at scale. Instead, you can efficiently navigate quality metrics and investigate issues. When metrics reveal improvement opportunities, the most cost-effective approach is often clarifying guidelines to enhance annotator productivity.
Beyond validating data quality, DQA helps you discover dataset limitations that could constrain your training and validation capabilities—preventing wasted annotation spend. When analyzing model performance, DQA provides quality insights that inform smarter investment decisions.
Practical Impact on Your Budget
Consider validating a regression model for object distance prediction using mean squared error (MSE). Even with a perfect model, noisy data limits your ability to assess improvements. Low-noise data yields an MSE of 0.0090, while high-noise data produces 0.160—a 17x difference.
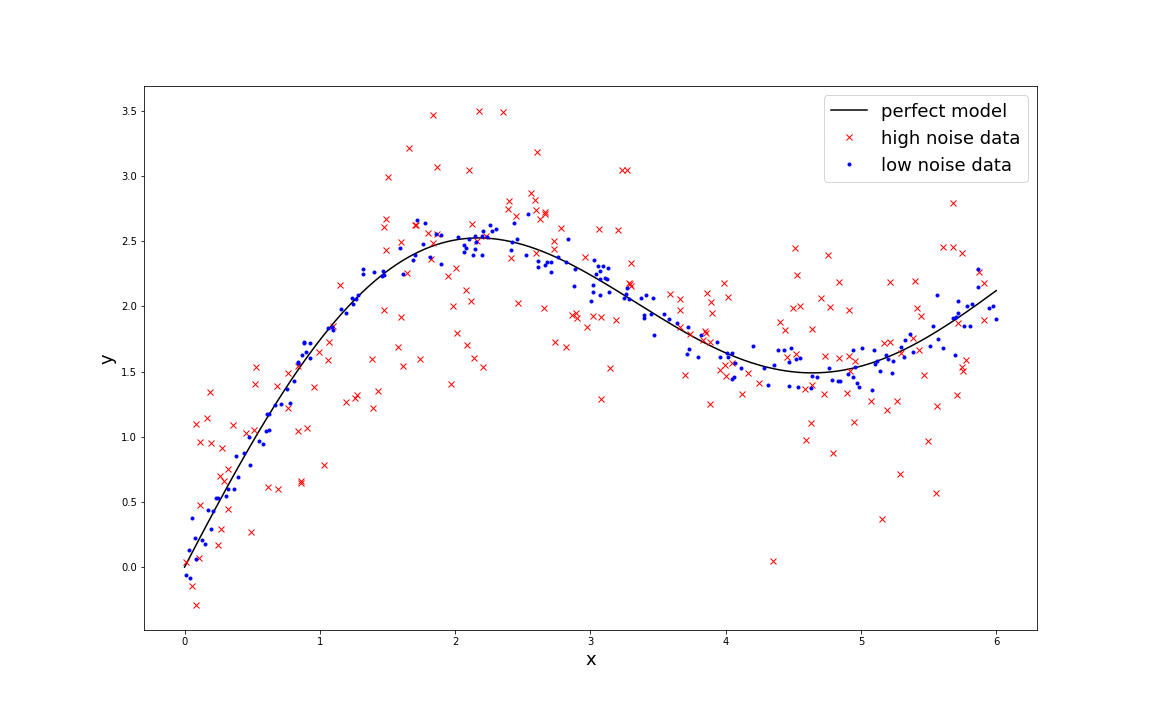
With our dataset quality metrics, you can understand your actual model performance by statistically modeling noise and measuring data variability. This prevents over-investing in annotations that won't improve results. In this example: Variance(measured) = Variance(model) + Variance(data).
Another example: if your object detection system shows an 85% detection rate, this might seem adequate. However, if your test dataset contains only 90% of all objects, your true system performance is 0.85 x 0.9 = 0.765—significantly lower. Understanding dataset quality prevents costly misallocation of annotation resources.
Real-world scenarios require sophisticated statistical models, but the principle remains: acknowledging data quality is essential for cost-efficient development and optimal resource allocation.
Maximize Annotation ROI with Data-Driven Decisions
Dataset Quality Analytics helps you identify true model performance and realistic improvement potential. This prevents wasted budget trying to improve models where quality constraints limit progress. More annotated data for your budget means faster development cycles.
Our dataset quality metrics reveal whether quality constraints are limiting your development velocity. By leveraging our statistical quality models for common perception modalities, you can make informed decisions about annotation investments, ensuring every dollar delivers maximum value—aligned with our mission to be the price leader in autonomy data annotation.
Are you maximizing your annotation budget? We understand building safe perception systems requires cost-efficient, scalable human feedback. Dataset Quality Analytics helps you get the most annotated autonomy data for your budget, accelerating your path to safer, more reliable autonomous systems.